Troubleshooting Program Stability using DynamoRIO
Program stability is somewhat different with regards to fuzzing versus how we generally perceive it.
Generally, we perceive program stability as — the program behaves in a consistent fashion and does not crash when we do an operation multiple times without restarting. A simple example for this would be opening a text file in notepad. Notepad should allow us to open a given text file multiple times without crashing, and it should load the file properly and display the contents to us.
Stability with regards to fuzzing goes slightly deeper — the program should behave in a consistent fashion. It should execute in the exact same way, executing the same instructions, given a certain input.
Stability affects a fuzzer’s performance and accuracy. If a program is unstable, the fuzzer will have difficulties in determining whether a crash is unique, and a fuzzer might spend more time than necessary to processing a given test case.
Dynamic Binary Instrumentation Frameworks
DBIs (Dynamic Binary Instrumentation) frameworks such as Intel Pin and DynamoRIO instrument a binary at runtime by injecting its own code into it. This provides insights into the runtime behaviour of the binary allowing the development of profiling and optimisation tools. Intel Pin and DynamoRIO also come with the ability to inject custom code in. This allows researchers to extend their features to suit their use cases. An example is the Pin code coverage tool (https://github.com/gaasedelen/lighthouse/blob/master/coverage/pin/README.md) which extends Pin’s capabilities to track code coverage and output it in a format suitable for consumption in Lighthouse.
While DBIs have many features, when it comes to fuzzing, the most important features would be using it to measure code coverage, allowing a fuzzer such as WinAFL to get feedback on the results of a test case (for fuzzing and minimizing the corpus) and dumping out instruction traces for debugging code stability.
How to Trace Instructions?
In order to debug stability, we need to be able to trace instructions. With the instruction trace, we’ll be able to find out if two invocations of a method will cause the same code to be executed for both. If the traces of the two invocations are different, this could be a potential warning sign that could mean that we’re either not calling and cleaning up the methods properly, or it is something inherent in the program being fuzzed.
Time for an example.

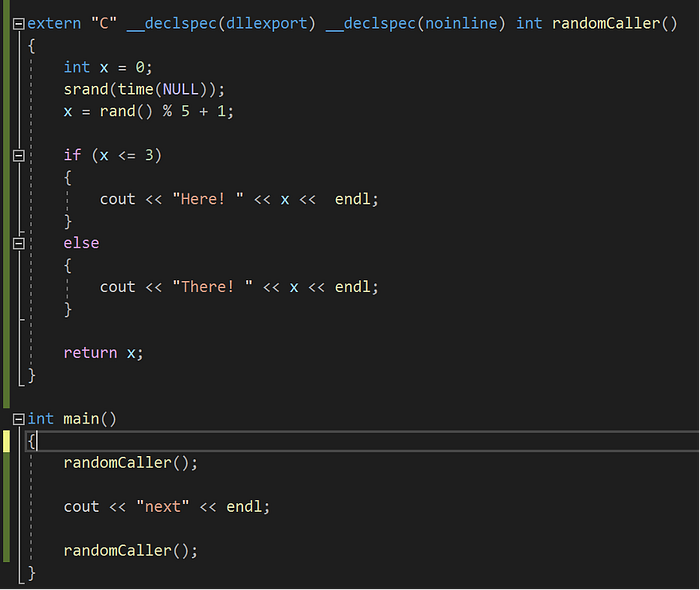
This is a simple program that generates a random value and prints either “Here!” Or “There!” based on the randomly generated value. Running randomCaller twice in the same process instance can cause a difference in execution traces depending on what’s x’s random value.
Let’s use DynamoRIO to trace the instructions executed.

We can see from the printouts that the program has executed both branches. Therefore we should see a difference in the execution traces between the first invocation and the second. The instruction traces output by DynamoRIO tend to be large (above 10mb), so do view them in a suitable editor.

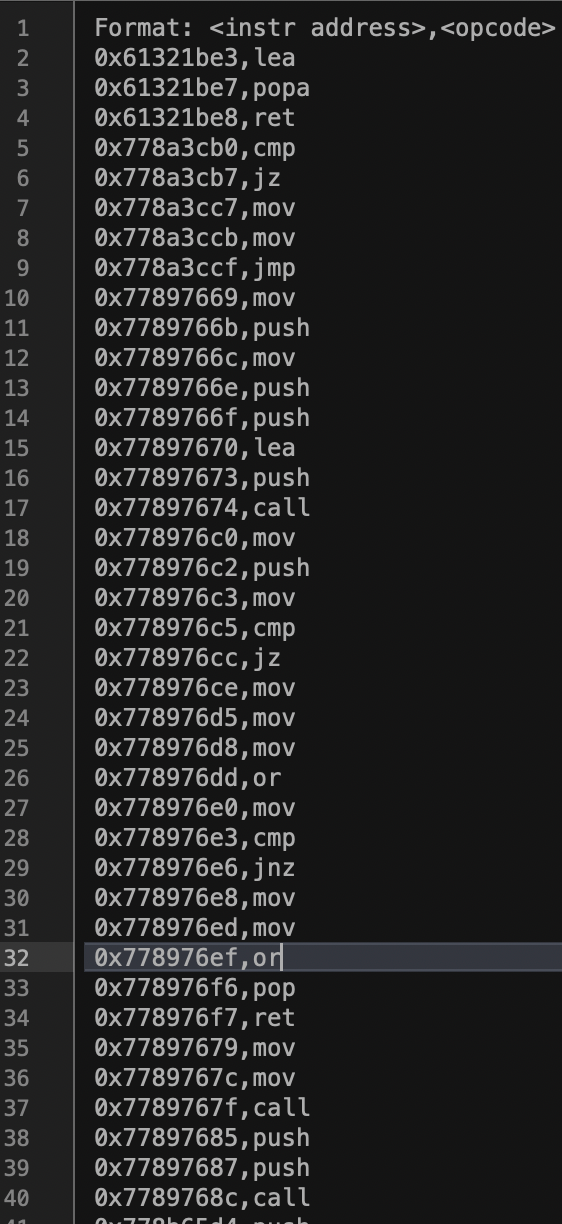
The dump shows the addresses and the instructions being run. Instructions in the high addresses will be instructions run by the operating system as it loads the program. In order to zoom in on the instructions of interest quickly, we suggest doing the following steps.
1. Disable ASLR. If the source code is available (as in most cases since the researcher will be writing the harness for fuzzing himself), he should disable ASLR so that the program can be loaded in the same address at all times. To disable ASLR in Visual Studio 2019, simply go to the project’s properties, go to Linker -> Command Line and enter “/DynamicBase:No”
2. Get the offsets via IDA. Load your program in IDA to retrieve the addresses of the starting and ending instructions

With these steps, you can easily search the dump file for the address and instructions to pull out each run of randomCaller.
To automate this process, we wrote a script to do this automatically. Given an instruction trace file and the start and ending addresses, our script will output two files, which are the first and second runs respectively.


As expected, the runs are slightly different, with the right one having an extra “0x401044,mov” instruction, which corresponds with Figure 5’s tiny block showing the instruction “mov edx, ‘There!’”.
From our little contrived example, we should now be able to use DynamoRIO to trace instructions and correlate them to the program. With regards to fuzzing, it may be advantageous to patch it so that the random seed is the same to ensure consistent behaviour.
When Code is Not What it is
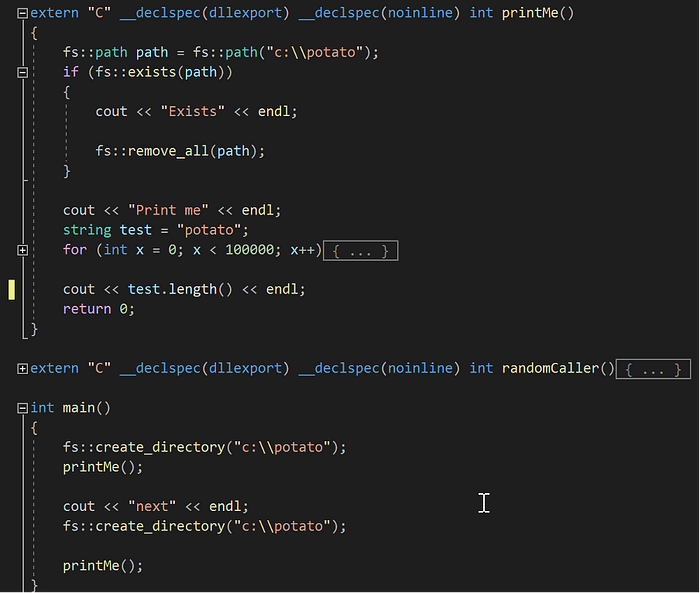
Here’s an example where the code should execute in the same fashion but in actuality, takes a slightly different path when you trace the instructions.

The code snippet in Figure 7 is simple. It will do the following in main():
- Create a directory in c drive named “potato”
- Call printMe
a. C:\potato will be deleted if it exists
b. Print out “Print me”
c. Do some operation to a string named test
d. Print out the string length
3. Repeat 1 and 2
For step 3, we might expect the instructions executed to be the same as the first two steps, however, that’s not the case.

Once we split up the separate runs into different files, we notice that they are different. The first run executes extra instructions.

When we look for the instruction 0x404b02, jnz in Ida, we come across this disassembly as shown in Figure 9. From Ida and the instruction traces, we can see that during the first run, eax was 0, thus causing the jnz instruction to not jump, and fall through to 0x404b04. Whereas for the second run, eax was 0, causing the jnz instruction to jump to the last block at 0x404b2a.
Why did the code behave differently? In this case it could be that the address of the function being retrieved in 0x40b15 was cached after the first run, so the second run did not need to retrieve it again. (This was tested on VS 2019 16.8.5. When VS was upgraded to 16.9.2, the program flow changed, and both runs behaved the same way).
While this example is very small, and pretty contrived, these are just illustrations whereby differences in code execution can cause stability to drop as the fuzzer perceives that a different execution path was taken while using a given input.
How Much is Enough?
When it comes to improving stability, how much patching is enough? Sadly, there is no simple answer to this. Ultimately, we cannot patch out every issue in our target library as the flow of it may be too affected to have a meaningful fuzzing session. As always, fuzzing is as much of an art as it is science.
